图表 RAG 揭秘
这个博客使用Python的Networkx库来实现Microsoft论文中提到的Graph RAG框架。
1. 简介
检索增强生成(RAG)是自然语言处理(NLP)中一种新兴技术,它将基于检索的方法的优势与生成模型的优势相结合。在这种方法中,一个检索系统 - 常常由像句子转换器这样的嵌入模型提供支持 - 根据用户查询从大型语料库中搜索相关文档或数据。然后,一种基于变压器结构的生成模型利用这些检索到的信息来生成更准确、与上下文相关和富有信息性的响应。
当与知识图谱结合时,RAG 已经展示出更大的成功。知识图谱提供了一个结构化、互联的信息框架,使得更精确的嵌入和更有效的检索成为可能。这提高了模型在查找相关信息方面的能力,特别是在复杂或领域特定的查询中。
最近,微软发布了一篇论文,重点介绍了这些进展,着重于在RAG框架中集成知识图。在这篇博客中,我们的目标是使用更简单、适用于生产的代码来复制同样的功能,使其适用于真实世界的应用程序,同时不牺牲性能或可伸缩性。
2. 创建文本块
在文件中概述的初始步骤涉及处理文件以创建文本块。虽然微软建议保持文本块大小低于800个标记,但我们选择了1200个标记的文本块大小,以最小化创建过多文本块的情况。为此,我们利用LangChain库中的递归字符文本拆分器来促进分块过程。
import fitz
import re
from langchain_text_splitters import RecursiveCharacterTextSplitter

# defining text splitter
text_splitter = RecursiveCharacterTextSplitter(
    chunk_size=1200,
    chunk_overlap=100,
    length_function=len,
    is_separator_regex=False,
)

# creating chunks from documnet
docname = "Astez Lifesciences Ltd.pdf"
doc = fitz.Document(docname)
pages = doc.page_count
chunks = []
for pageno in range(pages):
    page = doc.load_page(pageno)
    pagetext = page.get_text("text")
    pagetext = re.sub(r" +", r" ", pagetext)
    texts = text_splitter.create_documents([pagetext])
    for txt in texts:
        chunks.append(txt.page_content)
    chunks.append(pagetext)
3. 从块中提取实体
文件会定义特定实体类型,需要从文本块构建知识图。鉴于检索增强生成(RAG)框架的主要目标是解决来自指定文件的环境、社会和治理(ESG)问题,以下实体类型被界定 —
# defining entity types
entity_types = ["Scope 1 Emmission", "Scope 2 Emmission", "Scope 3 Emmission", "Energy reduction", "Co2",
                "Operational emmision", "Carbon",
                "Carbon Emmision reduction", "Target Announcement Year", "Target Baseline Year",
                "Target End/ Horizon Year", "Percentage Reduction (%)",
                "Percentage Reduction comprising Carbon Offsets or Carbon Removals (%)",
                "Details of Carbon Offsets or Carbon Removals to be used",
                "Target Type (Absolute, Intensity, or Other)(Please specify further detail if Other)",
                "Target Units (Relevant for 'Intensity' target type)"]
接下来是向LLM(OpenAI客户端)传递特定提示以及文本块。提示与微软代码存储库(https://github.com/microsoft/graphrag/tree/main/graphrag/prompt_tune/prompt)中定义的相同,并且还可以在博客末尾提到的我的GitHub链接中找到。
import openai
import httpx
import pandas as pd
from collections import defaultdict

# defining OpenAi client
client = openai.AsyncAzureOpenAI(
    azure_endpoint='***',
    api_key='***',
    api_version='***',
    http_client =  httpx.AsyncClient(verify=False)
)

# Extracting entitites and relationships for Knowledge Graph
chunk_rel_dct = defaultdict(list)
prompt = re.sub("{tuple_delimiter}", "<|>", ENTITY_EXTRACTION_PROMPT)
prompt = re.sub("{completion_delimiter}", "<|COMPLETE|>", prompt)
prompt = re.sub("{entity_types}", str(entity_types), prompt)
prompt = re.sub("{record_delimiter}", "##", prompt)

for idx, chunk in tqdm(enumerate(chunks)):
    chunk_rel_dct["Chunk_text_id"].append(f"Chunk_{idx}")
    chunk_rel_dct["Chunk_text"].append(chunk)
    chunk_prompt = re.sub("{input_text}", chunk, prompt)

    entities_extracted = await client.chat.completions.create(
                                    model="gpt-35-turbo-16k",
                                    temperature=0.1,
                                    messages=[{"role": "user", "content": chunk_prompt}],
                                    stream=False
                                )
    chunk_rel_dct["Entities_extracted"].append(entities_extracted.choices[0].message.content)

pd.DataFrame(chunk_rel_dct).to_csv("chunk_text.csv", index=False)
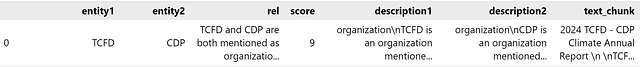
从每个文本块中,LLM创建实体,其中包括实体名称和描述,还有它们之间的关系以及关系分数。下面给出一个示例-
(“entity” ”温室气体排放减少目标” ”温室气体排放减少目标指PACCAR设定的特定目标,旨在减少其全球设施的CO2排放量。”)(“entity” ”2030"”2030是PACCAR旨在实现其温室气体排放减少目标的目标年份。”)(“relationship” ”温室气体排放减少目标” ”2030"” PACCAR旨在到2030年实现其温室气体排放减少目标,表明目标完成/到期年份。” 9)
4. 创建知识图谱
从上一步提取的数据被转换成数据框,以帮助创建知识图。
df = pd.read_csv("chunk_text.csv")

# processing the entities in specific format for knowledge graph creation
data = []

for i in range(df.shape[0]):
    try:
        x = re.sub(re.escape("<|COMPLETE|>"), "", df.iloc[i,-1])
        x = x.replace("\n", "")
        x = x.split("##")
        entities = {}
        for y in x:
            y= y.strip("()").split("<|>")
            y = [z.strip('"') for z in y]
            if y[0] == "entity":
                if y[1] not in entities.keys():
                    entities[y[1].upper()] = y[2] + "\n" + y[3]
                else:
                    entities[y[1].upper()] += "\n" + y[2] + "\n" + y[3]

        for y in x:
            y= y.strip("()").split("<|>")
            y = [z.strip('"') for z in y]
            if y[0] == "relationship":
                if len(y)!=5:
                    print(f"Assigning arbitary rank 1 for Chunk_{i} for relationship {y}")
                    y.append("1")

                if y[1] not in entities.keys():
                    entities[y[1].upper()] = " "
                if y[2] not in entities.keys():
                    entities[y[2].upper()] = " "

                dct = {"entity1": y[1].upper(),
                       "entity2": y[2].upper(),
                       "rel": y[3],
                       "score": int(y[4]),
                       "description1": entities[y[1].upper()],
                       "description2": entities[y[2].upper()],
                       "text_chunk": df.loc[i,'Chunk_text']
                        }
                data.append(dct)
    except Exception as e:
        print(f"Error in parsing Chunk_{i}", e)
        print(y)
        break

df = pd.DataFrame(data)
df.head(1)
随后,我们利用NetworkX库基于上述数据框架构建知识图。每个节点都带有其实体名称并具有两个属性:节点描述和从中提取的相应文本块。同样,连接两个节点的每条边都包括两个属性:关系描述和得分。对于节点或关系具有多个描述的情况,这些描述会被串联起来形成一个综合表示。
import networkx as nx

# creating knowledge graph
G = nx.Graph()

# Add nodes with descriptions and associated text chunks
for _, row in df.iterrows():
    if G.has_node(row['entity1']):
        G.nodes[row['entity1']]['chunks'].add(row['text_chunk'])
        G.nodes[row['entity1']]['description'].add(row['description1'])
    else:
        G.add_node(row['entity1'], description={row['description1']}, chunks={row['text_chunk']})

    if G.has_node(row['entity2']):
        G.nodes[row['entity2']]['chunks'].add(row['text_chunk'])
        G.nodes[row['entity2']]['description'].add(row['description2'])
    else:
        G.add_node(row['entity2'], description={row['description2']}, chunks={row['text_chunk']})

# Add edges with relationships and scores
for _, row in df.iterrows():
    if G.has_edge(row['entity1'], row['entity2']):
        existing_data = G[row['entity1']][row['entity2']]
        existing_data['relationship'] += f"\n{row['rel']}"
        existing_data['score'] = max(existing_data['score'], row['score'])
    else:
        G.add_edge(row['entity1'], row['entity2'], relationship=row['rel'], score=row['score'])

# Convert the set of text chunks to a list
for node in G.nodes:
    G.nodes[node]['chunks'] = list(G.nodes[node]['chunks'])

# Concat descriptions
for node in G.nodes:
    G.nodes[node]['description'] = "\n".join(list(G.nodes[node]['description']))
最初的知识图已经创建完成,可以如下所示进行可视化展示。

5. 知识图谱中的实体去重
这篇论文解释了我们需要合并相似的实体,以确保一致性和更好的检索。我们通过以下3个步骤实现相同的目的 -
用节点及其描述创建嵌入 — 我们使用Ollama的nomic-embed-text模型,从节点及其对应的描述中生成文本嵌入。
import ollama

# creating embedding from the nodes and their description
!ollama pull nomic-embed-text

lst = []
nodes_label_mapping_lst = []
for node in tqdm(G.nodes(data=True)):
    entity = "\nName: " + node[0] + " \nDescription: " + node[1]['description']
    embed = ollama.embeddings(model="nomic-embed-text", prompt=entity)['embedding']
    lst.append(embed)
    nodes_label_mapping_lst.append(node[0])

print(len(lst), len(nodes_label_mapping_lst))
b. 聚类相似节点 - 首先从图中构建邻接矩阵(A),其中如果两个对应节点的嵌入之间的余弦相似度超过0.9,则每个元素(A[i][j])被赋值为1,否则为0。此过程确保只考虑高度相似的节点相连。随后,使用广度优先搜索(BFS)算法在矩阵中识别相似节点组。
from sklearn.metrics.pairwise import cosine_similarity
import numpy as np

# creating adjacency matrix from the graph using a cutoff of 0.9 for cosine similarity
X = np.array(lst)
cosine_sim = cosine_similarity(X)
np.fill_diagonal(cosine_sim, 0)
cosine_sim = np.where(cosine_sim >= 0.9, 1, 0)

# creating adjacency list from above matrix
adjacency_list = defaultdict(list)
for i in range(cosine_sim.shape[0]):
    not_connected = True
    for j in range(cosine_sim.shape[0]):
        if cosine_sim[i,j]==1:
            not_connected = False
            adjacency_list[i].append(j)
    if not_connected:
        adjacency_list[i].append(i)

# creating list of connected nodes by clustering above connectivity data using BFS
connected_components = []
for key in adjacency_list.keys():
    if key not in [x for y in connected_components for x in y]:
        visited = []
        queue = [key]
        while len(queue)>0:
            node = queue.pop(0)
            if node not in visited:
                visited.append(node)
                for neighbour in adjacency_list[node]:
                    queue.append(neighbour)
        connected_components.append(visited)

nodes_to_merge_lst = [set(nodes_label_mapping_lst[y] for y in x) for x in connected_components]
c. 构建新的知识图谱 - 从上一步骤中识别的一组相似节点中,通过合并这些相似节点重构知识图谱。这个过程涉及消除原始节点并重新绘制关系以反映图谱内新的、合并的实体。
G_copy = copy.deepcopy(G)

for nodes_to_merge in nodes_to_merge_lst:
 if len(nodes_to_merge)>1:
  # Create a new node as the merged node
  merged_node = "\n".join(list(nodes_to_merge))
  G_copy.add_node(merged_node, description=set(), chunks=set())

  # Merge node properties
  for node in nodes_to_merge:
   if G_copy.has_node(node):
    node_data = G_copy.nodes[node]
    G_copy.nodes[merged_node]['description'].add(node_data.get('description'))
    G_copy.nodes[merged_node]['chunks'].update(node_data.get('chunks'))

  G_copy.nodes[merged_node]['chunks'] = list(G_copy.nodes[merged_node]['chunks'])
  G_copy.nodes[merged_node]['description'] = "\n".join(list(G_copy.nodes[merged_node]['description']))

  # Update edges
  for node1, node2, data in G.edges(data=True):
   if node1 in nodes_to_merge or node2 in nodes_to_merge:
    new_node1 = merged_node if node1 in nodes_to_merge else node1
    new_node2 = merged_node if node2 in nodes_to_merge else node2

    if new_node1 != new_node2:
     if G_copy.has_edge(new_node1, new_node2):
      existing_data = G_copy[new_node1][new_node2]
      existing_data['relationship'] += f"\n{data['relationship']}"
      existing_data['score'] = max(existing_data['score'], data['score'])
     else:
      G_copy.add_edge(new_node1, new_node2, relationship=data['relationship'], score=data['score'])

# Remove old nodes
for nodes_to_merge in nodes_to_merge_lst:
 if len(nodes_to_merge)>1:
  G_copy.remove_nodes_from(nodes_to_merge)

# checking if merging has been successful
assert len(G.nodes) - len([y for x in nodes_to_merge_lst for y in x if len(x)>1]) + \
    len([x for x in nodes_to_merge_lst if len(x)>1]) == len(G_copy.nodes), "Merging not sucessful"

# deleting earlier graph
del G
G = G_copy
6. 节点描述和关系总结
如前所述,来自不同块的重复实体将它们的节点和关系描述连接在一起。此外,在合并相似节点的过程中,采用相同的方法。本文强调了利用语言模型(LLM)对这些描述进行总结以确保连贯的表示的必要性。因此,我们使用特定的提示来总结实体和关系描述,将它们限制在300个标记长度。这些提示可以在微软库或我的GitHub页面中找到。
import tiktoken

# summarizing node description
encoding = tiktoken.encoding_for_model("gpt-3.5-turbo")

for node, data in tqdm(G.nodes(data=True)):
    if len(encoding.encode(data['description']))>300:
        print(f"Description summerized for Node_{node}")
        prompt = ENTITY_DESCRIPTION_SUMMARIZATION_PROMPT.replace("{entity_name}", node)
        prompt = prompt.replace("{description_list}", str([data['description']]))
        desc = await client.chat.completions.create(
                                    model="gpt-35-turbo-16k",
                                    temperature=0.1,
                                    messages=[{"role": "user", "content": prompt}],
                                    stream=False
                                )
        desc = desc.choices[0].message.content
        data['description'] = desc

# summarizing relationship description
for node1, node2, data in tqdm(G.edges(data=True)):
    if len(encoding.encode(data['relationship']))>300:
        print(f"Relationship summerized bw Node1 ({node1}) and Node2 ({node2})")
        prompt = RELATIONSHIP_SUMMARIZATION_PROMPT.replace("{entity_name1, entity_name2}", f"{node1}, {node2}")
        prompt = prompt.replace("{relationships_list}", str([data['relationship']]))
        desc = await client.chat.completions.create(
                                    model="gpt-35-turbo-16k",
                                    temperature=0.1,
                                    messages=[{"role": "user", "content": prompt}],
                                    stream=False
                                )
        desc = desc.choices[0].message.content
        data['relationship'] = desc
7. 创建社区和社区摘要
这一步介绍了Microsoft GraphRag论文中提到的新功能。该论文概述了使用Leiden提出的社区检测算法从节点创建分层聚类。还提供了叶子聚类中节点数量的最大截止值。随后,从底向上的方式生成从节点描述和它们之间的关系中生成摘要,从叶子节点开始并到根节点。这个过程为每个节点生成多个级别的摘要,有助于从远处的节点检索信息。我们使用特定提示来生成聚类摘要,这在我的代码库中有记录。
from graspologic.partition import hierarchical_leiden

# creating prompt for community summarization
def community_summary_prompt_generator(cluster_id, cluster_nodes):
    cluster_info = {
      "communityId": cluster_id,
      "nodes": [],
      "relationships": []
    }

    for node in cluster_nodes:
      node_data = G.nodes[node]
      node_info = {
        "id": node,
        "description": node_data["description"]
      }
      cluster_info["nodes"].append(node_info)

    for node1, node2, data in G.edges(data=True):
      if node1 in cluster_nodes and node2 in cluster_nodes:
        relationship_info = {
          "start": node1,
          "description": data["relationship"],
          "end": node2
        }
        cluster_info["relationships"].append(relationship_info)

    return cluster_info

# creating hierarchial clusters using community detection algo
communities = hierarchical_leiden(G, max_cluster_size=10)

# generating community summaries
node_cluster_dct = defaultdict(list)
for community in communities:
    node_cluster_dct[community.node].append((community.cluster, community.level))

cluster_node_dct = defaultdict(list)
for community in communities:
    cluster_node_dct[community.cluster].append(community.node)

community_summary = {}
encoding = tiktoken.encoding_for_model("gpt-3.5-turbo")
for key, val in tqdm(cluster_node_dct.items()):
    prompt = COMMUNITY_SUMMARIZATION_PROMPT.replace("{community_info}",
                                                    str(community_summary_prompt_generator(key, val)))
    if len(encoding.encode(prompt))>10000:
        prompt = " ".join(prompt.split()[:10000])
        print(f"prompt truncated for Cluster_{key}")

    summary = await client.chat.completions.create(
            model="gpt-35-turbo-16k",
            temperature=0.1,
            messages=[{"role": "user", "content": prompt}],
            stream=False
        )

    community_summary[key] = summary.choices[0].message.content

# storing all community summaries at different heirarchial level for each node
for node, data in tqdm(G.nodes(data=True)):
    if node in node_cluster_dct.keys():
        node_level_summary = []
        for level in sorted(list(set([x[1] for x in node_cluster_dct[node]]))):
            associated_communities = [y for y in node_cluster_dct[node] if y[1]==level]
            associated_communities_summaries = [community_summary[y[0]] for y in associated_communities]
            node_level_summary.append(("\n".join(associated_communities_summaries), level))
        data["community_summaries"] = [y[0] for y in sorted(node_level_summary, key = lambda x:x[1], reverse=True)]
    else:
        data["community_summaries"] = " "
8. 创建和存储节点嵌入
本节描述了创建知识图的最后一步。在典型的检索增强生成(RAG)框架中,文本块的嵌入存储在矢量数据库中。同样,在知识图中,从节点标签和它们的描述生成的嵌入存储用于基于余弦相似度检索与用户查询相对应的嵌入。为了生成这些嵌入,我们利用Ollama的Nomic-Embed-Text模型,并将结果嵌入存储在Chroma数据库中。
from langchain_ollama import OllamaEmbeddings
from langchain_chroma import Chroma
import json
from networkx.readwrite import json_graph

embeddings = OllamaEmbeddings(model="nomic-embed-text")

# store node embeddings in vector database
docs = []
for node, data in tqdm(G.nodes(data=True)):
    entity = "\nName: " + node + " \nDescription: " + data['description']
    doc = Document(
    page_content=entity,
    metadata={"source": node}
    )
    docs.append(doc)

embedding_function = OllamaEmbeddings(model="nomic-embed-text")
db = Chroma.from_documents(docs, embedding_function)

# save Knowledge graph created in json
with open("graph.json", "w") as f:
    json.dump(json_graph.node_link_data(G), f)

# load knowledge graph
G = nx.Graph()
with open("graph.json", "r") as f:
    G_data = json.load(f)
    G = json_graph.node_link_graph(G_data)
9. 从知识图谱中查询
我们现在按照微软提出的Graph RAG框架已经开发出了一个完整的知识图谱。图谱的内容可以总结如下:
节点:每个节点都标记有其实体名称,并包含与关联文本块一起的摘要描述。
b. 关系: 每个关系由连接的节点标签组成,并附带总结的关系描述和关系分数。
c. 摘要:为每个节点提供多个级别的分层摘要,增强图表中信息的整体上下文和可访问性。
如论文所述,利用图形RAG框架的查询机制可以如下形式化: a. 节点提取 — 根据用户查询的嵌入,提取最相似的前k个节点。 b. 社区摘要提取 — 从前一步骤中识别的节点中提取多个级别的社区摘要。微软区分本地搜索和全球搜索;在本地搜索中,仅提取每个节点的直接摘要,而全球搜索可以按特定需求提取多个级别的摘要。 c. 内部关系提取 — 根据它们的关系分数,确定提取节点之间的前m个关系。 d. 外部关系提取 — 识别提取的节点与之前提取中未包括的其他外部节点之间的关系。利用关系分数提取前n个关系。 e. 生成响应 — 对于每个用户查询,编制相关节点标签、它们的描述和相关的块文本,以及节点和社区摘要之间的内部和外部关系。然后将所有这些信息用于生成对用户查询的连贯响应的特定提示。
query = '''Write a summary of scope 1 and scope 3 emission related to target Baseline Year, target end/horizon year,
percentage reduction. Give output in a json format.'''
topk_nodes=12
topk_chunks = 12
topk_internal_rel = 12
topk_external_rel = 12
nodes = db.similarity_search(query,topk_nodes)

# getting associated text chunks
chunks = []
query_embed = ollama.embeddings(model="nomic-embed-text", prompt=query)['embedding']
for node in nodes:
    chunks.extend(G.nodes[node.metadata["source"]]['chunks'])

chunks = list(set(chunks))
chunks_selected = chunks
len(chunks_selected)

# getting top k internal and external relationships
within_relationships = []
between_relationships = []
nodes_info = []
nodes_set = set([x.metadata["source"] for x in nodes])

for node1, node2, data in G.edges(data=True):
    relationship_info = {
        "start": node1,
        "end": node2,
        "description": data["relationship"],
        "score": data["score"]
    }
    if node1 in nodes_set and node2 in nodes_set:
        within_relationships.append(relationship_info)
    elif (node1 in nodes_set and node2 not in nodes_set) or (node2 in nodes_set and node1 not in nodes_set):
        between_relationships.append(relationship_info)

within_relationships = sorted(within_relationships, key=lambda x: x["score"], reverse=True)[:topk_internal_rel]
between_relationships = sorted(between_relationships, key=lambda x: x["score"], reverse=True)[:topk_external_rel]

all_nodes = set()
relationships = within_relationships + between_relationships

for rel in relationships:
    all_nodes.add(rel["start"])
    all_nodes.add(rel["end"])

for node in all_nodes:
    if node in G.nodes:
        node_data = G.nodes[node]
        node_info = {
            "id": node,
            "description": node_data["description"]
        }
        nodes_info.append(node_info)

relationships_selected = {
    "nodes": nodes_info,
    "relationships": relationships
}

# getting immediate summaries
summaries_selected = []
for node in nodes:
    summaries_selected.append(G.nodes[node.metadata["source"]]['community_summaries'][0])

len(summaries_selected)

# generating prompt
context = "CHUNK TEXT: \n" + "\n".join(chunks_selected) + \
        "\n\nNODES: \n" + str(relationships_selected["nodes"]) + \
        "\n\nRELATIONSHIPS: \n" + str(relationships_selected["relationships"]) + \
        "\n\nCUMMUNITY SUMMARIES: \n" + str(summaries_selected)

prompt = PREDICTION_PROMPT.replace("{question}", query)
prompt = prompt.replace("{context}", context)

# generating response
answer = await client.chat.completions.create(
            model="gpt-35-turbo-16k",
            temperature=0.1,
            messages=[{"role": "user", "content": prompt}],
            stream=False,
            seed=42
        )

answer.choices[0].message.content
我们可以看到查询包含来自文档多个部分的信息,因此包含了一个多跳问答模式。生成的响应经过评估,与实际情况匹配。
{
     \ n "Scope 1 Emission Summary": {
         \ n "Baseline Year": "2018",
         \ n "Target End/Horizon Year": "2030",
         \ n "Percentage Reduction": "35%" \ n
    },
     \ n "Scope 3 Emission Summary": {
         \ n "Baseline Year": "2018",
         \ n "Target End/Horizon Year": "2030",
         \ n "Percentage Reduction": "25%" \ n
    }
     \ n
}
10. 额外的想法...RAG + 想法图
根据微软介绍,图RAG在多跳问题回答和根据特定用户查询总结来自远程部分内容方面表现出有效性。然而,我发现这种方法存在两个显著缺点:
a. 耗时过程- 从文本块中提取实体及其关系的过程比传统 RAG 中使用句子转换器实施的嵌入方法耗时要多得多。对于包含 200-300 页文档的文档,这种提取过程可能会延长到数小时。此外,我发现语义块可能会比标准递归字符文本分割程序产生更好的结果,特别是在后续块相关的情况下,比如与特定定义或互连段落相关的情况。
b. 使用通用用户查询的局限性 - 对于更为通用的用户查询,特别是那些需要二元响应(例如是/否)并需要以一种思维链条方式生成的查询,Graph RAG 倾向于表现不佳。这种局限性是因为节点和关系是基于预先定义的特定实体类型而创建的。
为了应对这些挑战,可以采取一种替代方法,称为“思维图”。该方法涉及从RAG检索的上下文动态创建知识图,针对特定用户查询。
在我的观察中,当响应可以从上下文中检索到(准确的上下文检索)时,OpenAI的GPT模型在根据预定义的问题集构建知识图时是非常有效的。
例如,如果我们从文档中检索到一个冗长的定义,然后询问与该定义相关的多个问题,那么很明显,如果定义是广泛的,语言模型可能会在每组问题的上下文学习方面遇到困难。但是,通过使用特定的GRAPH_OF_THOUGHTS提示来生成一个知识图,使用一组预定义的问题,并随后利用相同的知识图来回答这些问题,我们可以获得更准确和上下文相关的回答。
思维图表提示可以使用以下提示创建 —
GRAPH_OF_THOUGHTS_PROMPT = '''
-Goal-
Given a text document that is potentially relevant to this activity and a set of questions, create a knowledge graph which will help in answering the questions from the text document containing all entities and all relationships among the identified entities.

-Steps-
1. Study the "Context" carefully and generate answer by thinking step by step for each question in the "Question_Set". Identify all entities from the generated answer. For each identified entity, extract the following information:
- entity_name: Name of the entity, capitalized
- entity_type: The type of entity
- entity_description: Comprehensive description of the entity's attributes and activities
Format each entity as ("entity"{tuple_delimiter}<entity_name>{tuple_delimiter}<entity_type>{tuple_delimiter}<entity_description>)

2. From the entities identified in step 1, identify all pairs of (source_entity, target_entity) that are *clearly related* to each other.
For each pair of related entities, extract the following information:
- source_entity: name of the source entity, as identified in step 1
- target_entity: name of the target entity, as identified in step 1
- relationship_description: explanation as to why you think the source entity and the target entity are related to each other
- relationship_strength: a numeric score indicating strength of the relationship between the source entity and target entity
Format each relationship as ("relationship"{tuple_delimiter}<source_entity>{tuple_delimiter}<target_entity>{tuple_delimiter}<relationship_description>{tuple_delimiter}<relationship_strength>)

3. Return output in English as a single list of all the entities and relationships identified in steps 1 and 2. Use **{record_delimiter}** as the list delimiter.

4. When finished, output {completion_delimiter}

######################
-Examples-
######################
Example 1:

Context:
while Alex clenched his jaw, the buzz of frustration dull against the backdrop of Taylor's authoritarian certainty. It was this competitive undercurrent that kept him alert, the sense that his and Jordan's shared commitment to discovery was an unspoken rebellion against Cruz's narrowing vision of control and order.

Then Taylor did something unexpected. They paused beside Jordan and, for a moment, observed the device with something akin to reverence. “If this tech can be understood..." Taylor said, their voice quieter, "It could change the game for us. For all of us.”

The underlying dismissal earlier seemed to falter, replaced by a glimpse of reluctant respect for the gravity of what lay in their hands. Jordan looked up, and for a fleeting heartbeat, their eyes locked with Taylor's, a wordless clash of wills softening into an uneasy truce.

It was a small transformation, barely perceptible, but one that Alex noted with an inward nod. They had all been brought here by different paths.

Question_Set:
1. What is the effect of Taylor on Alex?
2. What is common between Jordan and Alex? How is Cruz related to the same?
################
Output:
("entity"{tuple_delimiter}"Alex"{tuple_delimiter}"person"{tuple_delimiter}"Alex is a character who experiences frustration and is observant of the dynamics among other characters."){record_delimiter}
("entity"{tuple_delimiter}"Taylor"{tuple_delimiter}"person"{tuple_delimiter}"Taylor is portrayed with authoritarian certainty and shows a moment of reverence towards a device, indicating a change in perspective."){record_delimiter}
("entity"{tuple_delimiter}"Jordan"{tuple_delimiter}"person"{tuple_delimiter}"Jordan shares a commitment to discovery and has a significant interaction with Taylor regarding a device."){record_delimiter}
("entity"{tuple_delimiter}"Cruz"{tuple_delimiter}"person"{tuple_delimiter}"Cruz is associated with a vision of control and order, influencing the dynamics among other characters."){record_delimiter}
("relationship"{tuple_delimiter}"Alex"{tuple_delimiter}"Taylor"{tuple_delimiter}"Alex is affected by Taylor's authoritarian certainty and observes changes in Taylor's attitude towards the device."{tuple_delimiter}7){record_delimiter}
("relationship"{tuple_delimiter}"Alex"{tuple_delimiter}"Jordan"{tuple_delimiter}"Alex and Jordan share a commitment to discovery, which contrasts with Cruz's vision."{tuple_delimiter}6){record_delimiter}
#############################
Example 2:

Context:
They were no longer mere operatives; they had become guardians of a threshold, keepers of a message from a realm beyond stars and stripes. This elevation in their mission could not be shackled by regulations and established protocols—it demanded a new perspective, a new resolve.

Tension threaded through the dialogue of beeps and static as communications with Washington buzzed in the background. The team stood, a portentous air enveloping them. It was clear that the decisions they made in the ensuing hours could redefine humanity's place in the cosmos or condemn them to ignorance and potential peril.

Their connection to the stars solidified, the group moved to address the crystallizing warning, shifting from passive recipients to active participants. Mercer's latter instincts gained precedence— the team's mandate had evolved, no longer solely to observe and report but to interact and prepare. A metamorphosis had begun, and Operation: Dulce hummed with the newfound frequency of their daring, a tone set not by the earthly

Question_Set:
1. Who drives the decision making of the team?
2. Is the team directly involved in operation?
#############
Output:
("entity"{tuple_delimiter}"Washington"{tuple_delimiter}"location"{tuple_delimiter}"Washington is a location where communications are being received, indicating its importance in the decision-making process."){record_delimiter}
("entity"{tuple_delimiter}"Operation: Dulce"{tuple_delimiter}"mission"{tuple_delimiter}"Operation: Dulce is described as a mission that has evolved to interact and prepare, indicating a significant shift in objectives and activities."){record_delimiter}
("entity"{tuple_delimiter}"The team"{tuple_delimiter}"organization"{tuple_delimiter}"The team is portrayed as a group of individuals who have transitioned from passive observers to active participants in a mission, showing a dynamic change in their role."){record_delimiter}
("relationship"{tuple_delimiter}"The team"{tuple_delimiter}"Washington"{tuple_delimiter}"The team receives communications from Washington, which influences their decision-making process."{tuple_delimiter}7){record_delimiter}
("relationship"{tuple_delimiter}"The team"{tuple_delimiter}"Operation: Dulce"{tuple_delimiter}"The team is directly involved in Operation: Dulce, executing its evolved objectives and activities."{tuple_delimiter}9){completion_delimiter}
#############################
-Real Data-
######################
Context: {input_text}
Question_Set:
{question_set}
######################
Output:
'''
一旦知识图谱被创建,就可以用于后续的查询 -
GRAPH_OF_THOUGHTS_PREDICTION_PROMPT = '''
You are an helpful Question Answering AI assistant based on the relevant context provided.
In the context, you are provided information about nodes and relationships from a relevant portion of knowledge graph according to the question asked. The information is provided in the below format:
1. Format each entity as ("entity"{tuple_delimiter}<entity_name>{tuple_delimiter}<entity_type>{tuple_delimiter}<entity_description>)
2. Format each relationship as ("relationship"{tuple_delimiter}<source_entity>{tuple_delimiter}<target_entity>{tuple_delimiter}<relationship_description>{tuple_delimiter}<relationship_strength>)

#########################################################
Answer the question based on the below context provided and predict the most relevant answer.

Context: {knowledge_graph_created}

Question: {question}

Answer:
'''
所有我的代码都在我的GitHub资料库中。
参考资料
- arxiv.org/pdf/2404.16130
- GitHub — microsoft/graphrag:一种模块化图形检索增强生成(RAG)系统